Current Schumann resonance charts
Below you will find four current measurement charts from Tomsk State University. The images load directly from the university’s measurement website and refresh automatically every five minutes while you view the article. The date and time printed on each chart indicate the measurement time.
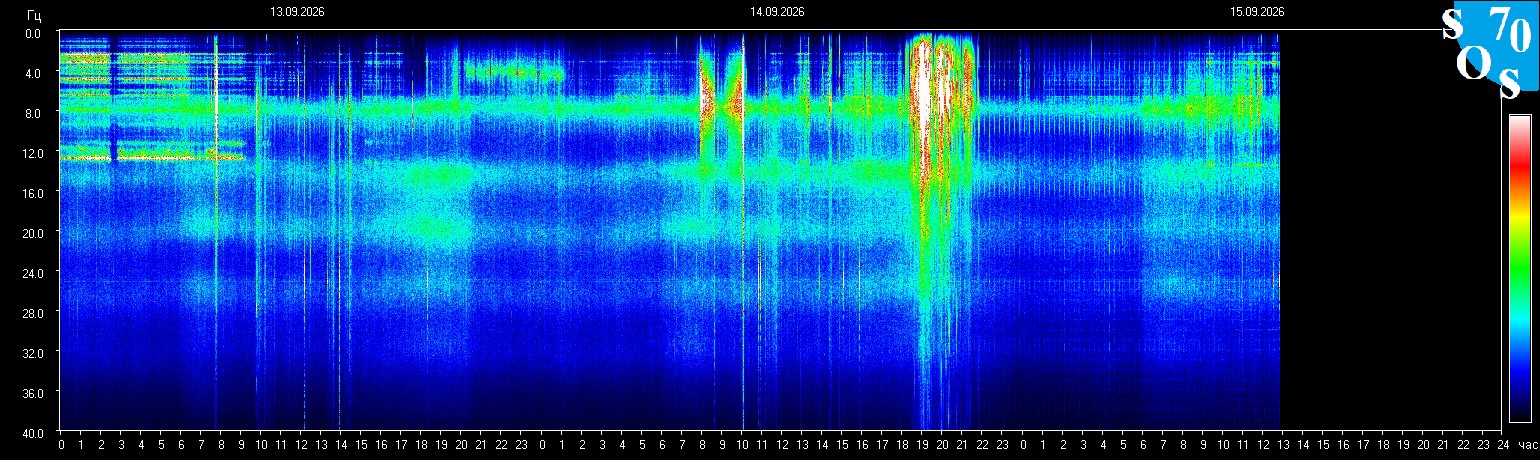
Schumann resonance spectrogram
The chart could not be refreshed. Check the date on the displayed image or open the source below the chart.
The horizontal axis shows time, the vertical axis frequency in Hz, and the colours show signal strength using the scale on the right. A brighter band means a stronger signal, not necessarily a higher frequency. A white vertical streak therefore does not mean the fundamental resonance has risen to 40 Hz. Black vertical gaps mean missing data; an empty right-hand area may represent time not yet recorded.
Source: Space Observing System 70 — Tomsk.
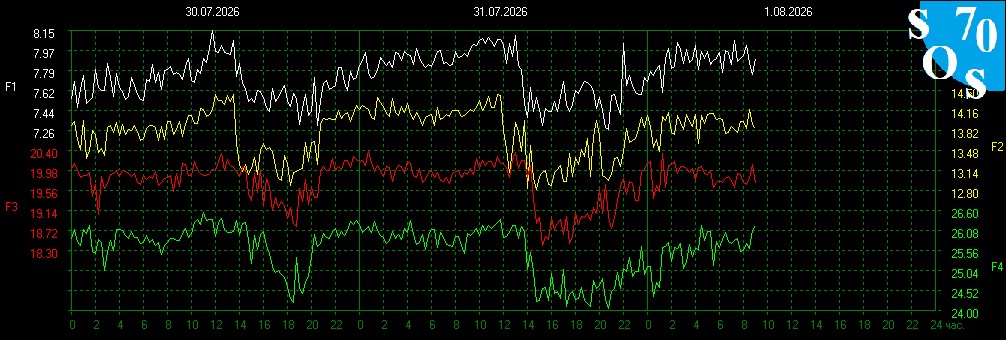
Schumann resonance frequencies
The chart could not be refreshed. Check the date on the displayed image or open the source below the chart.
Curves F1–F4 show the frequencies of the first four resonance modes in Hz over time. Read each coloured curve against its matching coloured scale at the edge. The scales differ and the curves are offset, so their heights in the image cannot be compared directly. This chart shows frequency, not signal strength.
Source: Space Observing System 70 — Tomsk.
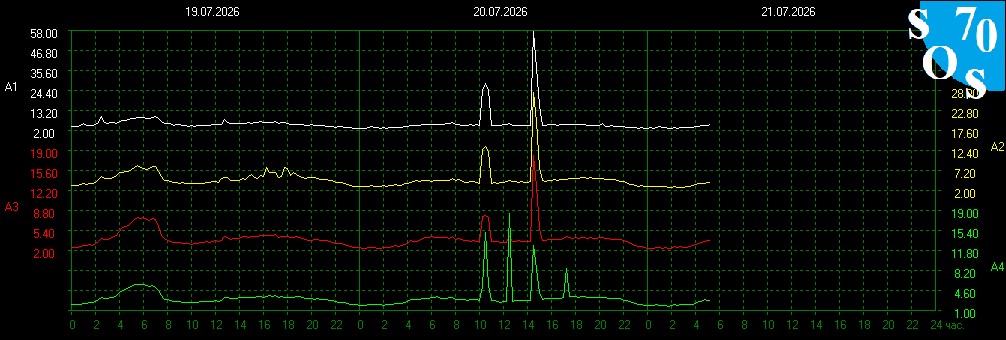
Schumann resonance amplitudes
The chart could not be refreshed. Check the date on the displayed image or open the source below the chart.
Curves A1–A4 show how the amplitudes of the first four resonance modes change over time. A higher peak on an individual curve means greater amplitude on its scale, not a higher frequency. Use the provider’s matching coloured scale; the heights of different coloured curves are not directly comparable.
Source: Space Observing System 70 — Tomsk.
Schumann resonance Q-factors

The chart could not be refreshed. Check the date on the displayed image or open the source below the chart.
Curves Q1–Q4 show the quality factors of the first four resonance modes over time. Q is a dimensionless measure of how sharp a resonance peak is: a higher Q means a narrower peak relative to its frequency. Read each curve against its matching coloured scale; Q is neither frequency in Hz nor signal amplitude.
Source: Space Observing System 70 — Tomsk.
How do we read a Schumann resonance chart?
The horizontal axis shows time, the vertical axis shows frequency in hertz (Hz), and color shows the intensity of the detected signal according to the provider’s scale. A brighter color does not mean that the fundamental frequency has increased. A white vertical trace extending to 40 Hz therefore does not, by itself, mean a fundamental Schumann resonance at 40 Hz.
- Blue: a weaker signal relative to the color scale used.
- Green, yellow, red and white: progressively stronger signal display. Without a reference scale, they must not be labeled “normal” or “abnormal” values.
- Black vertical bands: according to the Tomsk provider’s explanation, they mean missing measurements or an interruption in recording.
- Prominent white vertical impulses: may originate from local thunderstorms and lightning; interference may also appear on the spectrogram.
- Narrow horizontal lines: some may originate from technical sources. Not every line in the image is therefore a Schumann resonance mode.
The fundamental resonance mode is approximately at 7.8 Hz, with the next visible modes approximately at 14, 20 and 26 Hz. Actual values vary. The entire vertical axis represents the frequency range of the measurements, not a list consisting only of resonances.
Frequency, amplitude and quality factor
Frequency tells us how many oscillations occur per second. Amplitude describes the size of the oscillation; when reading measurements, always consider the unit and the method of signal processing. Q-factor or quality factor describes the sharpness of the resonance peak. These three quantities are not interchangeable.
Date and time on the charts
The Tomsk display generally covers three measurement days. Check the time at the source; when labeled UTC+7, subtract six hours in winter or five hours during daylight saving time to convert to Slovenian time. If the source uses UTC or another designation, adjust the conversion accordingly.
Explanations and data: Space Observing System 70 and resonance parameter display.
WHAT IS SCHUMANN RESONANCE?
Schumann Resonance is nicknamed the “heartbeat of Mother Earth.” It matches the ranges we see in our brain waves.
There is an atmospheric cavity between the ground and the ionosphere. Every second, approximately 1000 lightning strikes around the world harmonize impulses that travel through the atmosphere and send electromagnetic energy signals to all organisms.
These electromagnetic energy signals connect us to Earth’s magnetic field, and they are also influenced by mass emotions and human consciousness.
7.83 Hz
Human beings are attuned to Earth’s resonant vibration.
“Human beings vibrate (yes, that means you), and the frequency they emit ranges between 5 and 10 Hz. We are in the same range as Earth’s heartbeat – 7.83 Hz.
That is why nature is healing for people. It helps them align with Earth’s frequency of 7.83 Hz, increasing the body’s natural ability to heal and regulate itself.
As you will see later in this article, our brain waves can also be synchronized to the fundamental Schumann frequencies (7.83 Hz) through music, meditation and brain stimulation devices. One such device is F-Gen. While practicing meditation or relaxing in your preferred way, we recommend simultaneously using music at a frequency of 7.83 Hz and the F-Gen generator, also set to 7.83 Hz.
HOW DOES SCHUMANN RESONANCE ARISE? WATCH THE VIDEO…
HUMAN BIOLOGY
Studies have shown that Schumann resonance frequencies have effects on the human brain and nervous system, cardiovascular system, autonomic nervous system, circadian rhythms, immune function, DNA and more. Schumann resonance affects not only telecommunications services, but undoubtedly people as well. It also affects melatonin, which influences biological functions such as the circadian rhythm in both animals and humans. Melatonin not only regulates sleep patterns, but also regulates blood pressure and affects reproduction.
HUMAN BRAIN WAVES

Schumann Resonance ELF (Extremely Low Frequency) waves in Earth’s magnetic field overlap with our brain waves. The fundamental Schumann resonance, 7.83 Hz, corresponds to the high theta brain-wave range.
Delta brain waves – 0 Hz to 4 Hz
Delta brain waves correspond to the Schumann resonance of 4.11 Hz. This brain rhythm occurs during deep, dreamless sleep or unconsciousness. The rhythm is also associated with drowsiness.
Theta brain waves – 4 Hz to 8 Hz
Theta brain waves correspond to the Schumann resonance of 4.11 Hz and 7.83 Hz. This brain rhythm is also associated with drowsiness. It occurs in the first stage of sleep and during deep meditation, when we are awake but open to mental imagery. These waves are associated with creativity, intuition, daydreaming and fantasizing. They reflect the activity of the limbic system, and increased activity is observed in anxiety, behavioral activation and inhibition.
Normal Schumann resonance is here at 7.83 Hz, on the boundary between Theta and Alpha.
Alpha brain waves – 8 Hz to 12 Hz
Alpha brain waves correspond to the Schumann resonance of 7.83 Hz. This is the main rhythm observed in a normal, relaxed adult. It is present for most of life. It is considered the usual state during wakefulness, but does not actively process information. Alpha is associated with creativity (creative people show alpha when they listen and arrive at a solution) and mental work. Alpha activity is also associated with general mental and bodily/spiritual coordination, calmness, alertness and learning.
Beta brain waves – 12 Hz to 30 Hz*
Beta brain waves correspond to the Schumann resonance of 14 Hz, 20 Hz and 26 Hz. Beta reflects very active processing. It occurs during normal waking consciousness and external attention. Slow beta: 12-17 Hz means normal information processing and mental activity; Fast beta: 17-30 Hz means increased alertness and fight, flight or anxiety.
*Opinions differ on the boundary between the upper limit of beta and the onset of gamma brain waves. Some give 25 Hz, others 40 Hz. Most give 30 Hz. Keep in mind that the upper value may differ across sources.
Gamma brain waves – 30 Hz to 100 Hz
Gamma brain waves correspond to the Schumann resonance of 33 Hz, 39 Hz, 45 Hz and 59 Hz. They are associated with wakefulness and may occur when we process information in both brain hemispheres simultaneously. Whales and dolphins also operate at these frequencies.
RESONANCE & BRAIN WAVES
Vibrational frequencies can match or align with one another.
Schumann resonance can be better understood by studying matching vibrations. For example, when you set up two oscillating systems, one system will influence the other. When one begins to vibrate, the other will eventually vibrate in harmony with the first, or at the same frequency. As an example, consider two or more pendulum wall clocks in the same room – over time, the pendulums of all the clocks will work in synchrony. They will have the same oscillation period.
Synchronization is a process in which two interacting oscillating systems with different periods, operating independently of each other, adopt a common oscillation period. Both oscillating systems, or oscillators, may fall into synchrony, although other phase relationships are also possible.
The above therefore creates synchronization, harmonization. It refers to the matching of neurons in the brain that creates synchrony. Meditation maintains our connection with Schumann resonance or Earth’s oscillating frequency, which, as mentioned, is also called the heartbeat of Mother Earth.
Resonance “occurs when a given system, tuned to a particular frequency, begins to oscillate and amplifies the presence of a preferred external frequency. Those frequencies that maximize or amplify a given object so that it tunes to a particular frequency are called resonant frequencies. Together, two frequencies have the power to influence each other if both are tuned in accordance with resonance.”
Many cultures practice vibrational techniques with the aim of synchronizing with the frequencies of Schumann resonance or the “Heart of Mother Earth.” They believe that these frequencies can heal the body and mind as the energies connect. Schumann resonance also affects high blood pressure, which decreases, and depression is alleviated as well.
By synchronizing brain waves to the fundamental Schumann frequencies (7.83 Hz), through brain stimulation devices such as scalar-wave devices, pulsed magnetic therapy, music or meditation, we can tap into an enormous input of energy from Earth’s own energy field. One device that enables a biosphere favorable to life even in an environment affected by electrosmog produced by telephone transmitters, mobile phones, wi-fi, high-voltage power lines… is also F-Gen – read more about it HERE.
What are frequency and amplitude in vibrations?
- Frequency means how many wave cycles occur per second. 1 Hz means 1 cycle per second, 40 Hz means 40 cycles per second.
- Amplitude is the size of the vibration, how large the wave is.
DOES SCHUMANN RESONANCE AFFECT CONSCIOUSNESS?
“Increasing frequency causes an increase in consciousness. When our consciousness rises, we have greater awareness – these are gamma brain waves. Gamma brain waves, which can be more than twice as high as high beta brain waves, represent an awakened state in the brain, but are not associated with an emergency survival state. They are associated with a kind of super-consciousness and awareness, as well as greater amounts of love and compassion. As Earth goes through its metamorphosis, perhaps we too must pass through this period of emotional intensity associated with beta brain waves before entering a new consciousness of gamma brain-wave states. And would this not upgrade our nervous system and expand our perception and awareness of reality?”
Reading the SR chart

People often hear about Schumann resonance; some also read a little about it or even find charts that show it. Very few, however, actually know how it arises and what influence it has on life on our planet. We therefore decided to explain the basic facts about Schumann resonance on zapper-pro.si as accurately and simply as possible, while also providing more information for anyone interested in further detail.
Schumann resonance was named after the German scientist Winfried Otto Schumann (1888–1974), who in 1952 mathematically determined the frequency of Earth’s natural atmospheric activity. It depends on the surface area and mutual distance between Earth and the lower layer of the ionosphere, which, through their dimensions and properties, form a large natural capacitor. Under the influence of ionization in the upper layers of the atmosphere, an electrical voltage arises between Earth and the ionosphere, actively excited by around a thousand simultaneous lightning discharges worldwide. The result is the natural electromagnetic wave of Schumann resonance, which is 7.83 Hz.
Schumann resonance is a characteristic of Earth’s atmosphere and, since ancient times, has “created a biosphere favorable to life.” At the same time, it is also “the core of alpha-wave activity in the human brain during creative and relaxed wakefulness.” Schumann resonance is “closely connected with our well-being and bodily responses,” and a reduction in the power of Schumann resonance may “increase the number of heart attacks, cause mental and emotional unrest, anxiety, depression, nervous tension in relationships and stressful circumstances, reduce responsiveness, and increase the tendency toward accidents and crime.”
F-Gen and the frequency of 7.83 Hz
Read here about F-Gen, a frequency generator with nine frequencies, including the Schumann resonance of 7.83 Hz, which produces a pulsed magnetic field through two coils and sends it into the surrounding space, thereby creating a naturally favorable environment for people.
Sources and links
- Original Zapper-Pro chapter: “Schumann Resonance,” “Reading the SR Chart” and “Charts” (2021, later additions).
- Space Observing System 70, Tomsk — measurements and spectrogram explanation.
- Frequencies, amplitudes and quality factors.